Best Robo-Advisor Performance this Year
Investors love lists of the best robo-advisor returns and robo advisor performance data. If your robo receives a good robo advisor ranking then you’re happy because you believe that you made the “right” investment choice.
In fact, many investors want to choose their robo-advisor, based upon the best robo-advisor returns. Yet, robo investing returns are only a snapshot in time of a long investing life.
Actually, the winners and losers during a specific period don’t tell us which robo advisors returns will win for the long run. There’s another piece of the robo-advisor return puzzle worth noting; each robo offers multiple investment options.
For example, aggressive investors might own 80% stock investments and 20% bond funds. While the conservative folks own 50% or 60% stocks and the remainder in bond funds.
You can’t compare an aggressive portfolio with the robo-advisor performance of a conservative on. That’s a perfect example of an apples to oranges comparison.
This is a long way around of saying; take all return data with a grain of salt (even this report of the best robo-advisor returns this year).
While interesting, I’d use this data as one piece of a deep evaluation into specific robo advisory platforms.
Answer 4 question and find out the best robo advisor for you with our Robo Advisor Selection Wizard
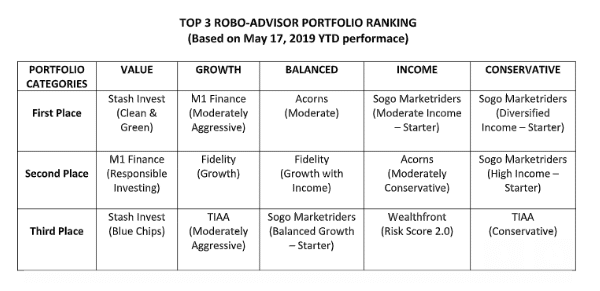
After analyzing roughly 300 robo-advisor platforms, Nummo, a personal financial management platform, came up with the top three robo-advisors across these categories. Each category represents a distinct asset allocation or asset mix between stock and bond investments.
- Value
- Growth
- Balanced
- Income
- Conservative
Best Robo-Advisor 2019 Performance Research Methods
Here’s the time period and portfolio types for this 2019 YTD robo-advisor return data.
The robo-advisor return year-to-date 2019 return data covers the period from December 31, 2018 (market close) and May 17, 2019. The investment portfolio composition was sourced on April 30, 2019.
Asset Allocation or Percent Invested in Stock Versus Bond Investments per Portfolio Type
| Investment Style | Maximum Stock/Equity Allocation | Income/ Fixed Allocation |
|---|---|---|
| Value | 100% | 0% |
| Growth | 75% | 25% |
| Balanced | 60% | 40% |
| Income | 45% | 55% |
| Conservative | 30% | 70% |
Best Robo-Advisor Returns for Each Category
Investors expect higher returns when taking on greater risk. In this case, greater risk means that there’s also more opportunity for investment losses. Because the stock market historically beats the bond market returns, you would expect portfolios with greater stock percentages to outperform the more conservative ones.
Following are the first, second and third place winners in the best robo-advisor returns data for this year.
“Only a few firms topped the YTD performance of the S&P 500 Index, which is up 14.06% as of May 17. The majority of robo-advisors, including those from Charles Schwab, Betterment, SigFig, Morgan Stanley, AssetBuilder and SoFi Wealth did not make the top three ranking in any portfolio category.” ~Nummo Robo-Advisor Ranking Press Release
data source; https://www.nummo.com/home
Value Returns
Value is the most aggressive category. The Value portfolio owns a maximum of 100% equity or stock investments.
The category average for the Value portfolio is 10.9%.
Within the Value Category the top three winners are:
- Stash Invest – Clean and Green Portfolio – Just invest, Retirement
- M1 Finance – Responsible Investing – Just Invest
- Stash Invest – Blue Chips – Just Invest, Retirement
The Stash Invest returns cleaned up this category winning the first and third place slots.
The individual robo-advisor returns ranged from a high of roughly 19.0% for Stash Invest’s Clean and Green Portfolio to 14.6% for Stash Invest’s Blue Chips portfolio.
The M1 Finance return of 16.7% was in the middle.
A 100% equity portfolio is great when the stock market is rising, but when the market sinks, you’ll lose more than a stock plus bond allocation.
Growth Returns
The average return for all robo-advisors in the growth category was 9.3%. The growth category owns up to 75% stock investments.
The top three growth winners were all in the 10% range:
- M1 Finance – Moderately Aggressive – Just Invest
- Fidelity Go – Growth – Just Invest
- TIAA Personal Portfolio – Moderately Aggressive – Just Invest, Retirement
The Fidelity Go returns were 10.4% with M1 Finance a hair above and TIAA a bit below.
With the M1 Finance robo-advisor category winner, you can choose from pre-made investment portfolios (or pies) or design your own. Either way, M1 finance will take care of rebalancing your investments.
Balanced Returns
For all the robo-advisors, the balanced category of 60% stock investments and 40% bonds saw an 8.2% average YTD return. Those solid robo-advisor returns for this year shows the positive investment returns for both stocks and bonds.
The winner yielded a new robo-advisors for this stock and bond mix:
- Acorns – Moderate – Just Invest, Retirement
- Fidelity Go – Growth with Income – Just Invest
- Sogo Marketriders – Balanced Growth, Starter – Just Invest, Retirement
Acorn returns won the moderate portfolio category with approximately a 10.0% return. The second and third place winners were held by Fidelity Go’s Growth with Income and Sogo Marketriders Balanced Growth – Starter portfolio. Their robo investing returns were in the mid 9.0% range.
The 60/40 stock/bond portfolio is a popular asset mix for investors that lean conservative and seek decent growth with a downside cushion for stock market drops.
The final two categories are more conservative investment portfolios with greater bond allocations than the previous allocations.
Income
This 45% maximum stock and 55% bond portfolio focuses more on income and capital preservation than the former more aggressive portfolios. The average YTD return of the income category was 7.2%, an impressive return, when compared to historical averages of 9% for stocks and 5% for bonds.
- Sogo Marketriders – Moderate Income, Starter – Just Invest, Retirement
- Acorns – Moderately Conservative – Just Invest, Retirement
- Wealthfront – Risk Score 2.0 – Just Invest, College
Wealthfront returns for the third place were 8.2% for the period. While the top two were just slightly ahead with Sogo Marketriders yielding 8.8% and Acorns with 8.3% performance.
The final portfolio is extremely conservative and appropriate for the squeamish investor or those in retirement.
Conservative
Best robo advisor returns category average for conservative investors was a respectable 4.7%. The conservative portfolio gives a 30% nod to stocks with the bulk of the portfolio, 70%, invested in bond investments.
The winners in this portfolio are familiar names from the prior categories.
- Sogo Marketriders – Diversified Income – Just Invest, Retirement
- Sogo Marketriders – High Income, Starter – Just Invest, Retirement
- TIAA Personal Portfolio – Conservative – Just Invest, Retirement
Robo Advisor Performance Comparison Wrap Up
This year has been outstanding for stock, bond and robo-advisor returns. The robo investing returns reflect the underlying funds, percentages and rebalancing for each platform. You’ll also notice that last year’s best robo-advisor performance yielded winners not included in this years list.
Wealthsimple and Ellevest were included in best robo-advisor return lists last year, but not this.
And, Wealthfront and M1 appeared on both robo-advisor performance comparisons.
The lesson, as we mentioned above, is that robo-advisor return data is fluid and depends upon many factors.
Peruse the data, investigate the various robo-advisor fintech platforms, but in the end, make your investment decision based upon the most important factors for you.
*Featured image credit: Photo by Guille Álvarez on Unsplash