Robo-Advisor Performance
As a multi-decade investor I know the allure of high investment returns. It’s wonderful to imagine that a fund’s 20% one-year return will continue into the future. Many investors make that assumption and jump into the funds with top returns.
Robo-advisor performance records allow you to find out who those winners are!
But, just because you can – choose a robo-advisor with the highest returns – doesn’t mean that you should.
There’s no guarantee that the winning robo-advisor, investment manager or exchange traded fund (ETF) from last year will repeat their performance.
[toc]
Another problem with choosing a robo-advisor based upon the “best robo advisor returns” is that you must be extremely clear on how you are measuring and calculating those returns.
“We compare portfolios based on risk tolerance. That way you’re considering returns that match your particular risk level.” ~Roi Tavor, CEO Nummo.com
Before we get into the Robo Advisor Performance data, let’s delve into the issues surrounding measuring the best robo advisor returns, details of how returns are calculated and questions that need to be resolved.
The data for the Robo-Advisor Performance Ranking 2020 report is sourced from Nummo, a personal financial management platform focused on helping you manage and improve financial health.
Understanding Robo-Advisor Investment Choices
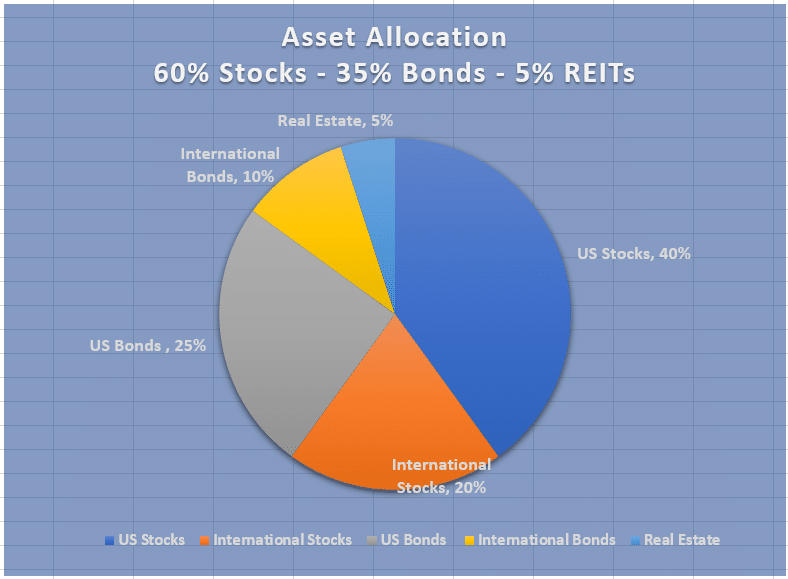
Each robo-advisor offers multiple portfolios. When you invest with a robo-advisor you typically choose a specific risk level from conservative to aggressive. A conservative portfolio at one robo might own 50% stocks and 50% fixed assets. While a conservative portfolio at another might own 60% stocks, 30% bonds and 10% real estate investments. So, when calculating a robo-advisor performance comparison, you must understand which asset allocation you’re comparing.
It doesn’t make sense to compare a 50% stock – 50% bond portfolio with a 60% stock, 30% bond and 10% real estate asset mix.
You also want to examine data that reflects your own asset allocation.
If you’re a 35 year old investor, with a “retirement portfolio” and expect to leave your money untouched for 30 years, you might invest in an aggressive portfolio with more stock funds and fewer bond funds. Subsequently, returns for a conservative portfolio aren’t applicable for your situation. You’re interested in the returns of an aggressive asset allocation!
Which robo-advisor has the best returns – for one year – may not matter.
Finally, one year or even a few years of performance data might not mean a lot. If growth stocks are in favor, like they have been recently, then you would expect that robo-advisors that own growth-oriented ETFs would outperform those that didn’t, despite the underlying asset allocation.
It’s quite rare for a fund, robo-advisor or even an individual stock to outperform for many consecutive years. That’s why the best robo-advisor in 2018 might not be among this year’s ranking list of best robo advisor 2019.
Robo-Advisor Performance 2019 – Methodology
Roi Tavor, CEO at Nummo delved into the methodology for the robo investing returns data during a recent phone call.
“Our primary focus in publishing the robo advisor performance data is a desire for transparency.” Roi Tavor
Nummo and his colleagues reviewed over 300 individual portfolios and compared them based upon risk tolerance, not broader aggregate returns. This is distinct from other robo advisor comparison data.
All data was sourced from Morningstar, a reliable information provider.
The investment portfolios were categorized by the robo-advisors as either a “retirement” or “just investing” portfolio. While some of the portfolios fit into both categories.
Although Nummo follows 26 robo-advisors, only 19 were considered for this best robo-advisor performance report. In order to be eligible for consideration, the investment funds and asset allocation for each risk level must be publicly available.
Think of it this way. Would you invest with a company who asked you some risk and goal questions, crafts an investment portfolio to fit with your responses, but won’t show you the investments until you sign up and fund the account? That doesn’t make sense. It’s like buying a car sight unseen after filling out a questionnaire about your preferences.
We applaud Nummo for requiring that the best robo advisor’s returns are only from companies that make their portfolios available, before they are funded.
So, with these caveats in mind, take all return data with a grain of salt.
Choose the best robo-advisor for you with the Robo-Advisor Selection Wizard.
Balanced Portfolio Example
Robo Advisor Performance – Participants and Portfolios
Specifications: The robo-advisor performance is calculated for the time period between 12/31/2018 and 1/1/2020. All return data is before fees. The portfolio was based upon the composition as of February 1, 2020.
Nineteen of the 26 robo-advisors covered by Nummo were included in this analysis as seven of the firms lacked sufficient information.
The robo advisors included in this analysis:
- Acorns
- Aspiration
- AssetBuilder
- Axos Invest
- Betterment
- Schwab Intelligent Portfolios
- Ellevest
- Fidelity Go
- JP Morgan
- M1 Finance
- Morgan Stanley
- SigFig
- SoFi Invest
- Sogo Marketriders
- Stash Invest
- TIAA Personal Portfolio
- Wealthfront
- Wealthsimple
The robo-advisor performance results are categorized according to “Retirement” or “Just Investing” portfolios first and next by asset allocations. Some portfolios were listed as available through both the “Retirement” and “Just Investing” categories. The asset allocation category is measured by the maximum percent of equityies within the portfolio.
Following are the parameters for each of the portfolios:
Retirement
Conservative – maximum equity of 30%
Income – maximum equity of 45%
Balanced – maximum equity of 60%
Growth – maximum equity of 75%
Value – maximum equity of 100%
Just Invest Portfolios
Conservative – maximum equity of 30%
Income – maximum equity of 45%
Balanced – maximum equity of 60%
Growth – maximum equity of 75%
Value – maximum equity of 100%
How to Use the Robo-Advisor Performance Data
Use the data as one piece of information for your robo-advisor comparison and selection.
Compare these returns with your own investment returns and/or those of a professionally managed portfolio. Consider whether you’re getting competitive returns for the amount of risk you’re taking.
Realize that all the return data is before fees. So, if you’re looking at the returns of a Wealthfront portfolio, to get the net, after fee return, subtract the annual management fee of 0.25% from the one-year performance data.
You can get all of the robo-advisor fee information from our Robo Advisor Comparison chart. Sign up here:
(Unsubscribe at any time)
Be aware that within each category there are deviations in asset allocation, so take that into consideration when reviewing the one-year robo investing performance.
For example, in the Conservative Portfolios – Retirement, the Maximum Equity Allocation is 30%. That means that some portfolios might own less than 30% equities.
This is reflected in the top 2 robo advisor rankings:
Wealthfront – Risk Score 0.50 – 17.43% return
Wealthfront – Risk Score 1.00 – 17.12% return
The higher risk score of 1.0 will likely own a greater percent of stock investments than the less risky 0.50% risk score portfolio.
So, it’s important to understand that within each category, there will be variations in the exact percentages of stocks vs bonds vs other asset classes.
Best Robo-Advisor Performance by Category
When looking at the best performing robo-advisor data, consider the asset allocation for each category. During 2019, you would expect those portfolios with greater amounts of stocks to outperform those with greater amounts of cash and bonds.
All returns are driven by:
- The portfolio composition of stock, bond, and alternative funds
- The percentage invested in each fund.
The average category returns are presented for comparison.
Following are the five Retirement Portfolios, categorized by asset allocation – maximum percent of equities within the portfolio.
Best Robo-Advisor Performance – Retirement Portfolios – by Risk Level
These are the five investment categories, categorized by the robos as “Retirement” portfolios. Within each retirement portfolio are the winners, categorized by the maximum percent allocated to equities.
Conservative – Retirement
Maximum Equity Allocation of 30%
Category average return – 10.25%
| Ranking | Robo Advisor | Portfolio Name | Account Type | Investment Strategy | 1 year Performance |
| 1 | Wealthfront | Risk Score 0.5 | Retirement | Passive | 17.43% |
| 2 | Wealthfront | Risk Score 1.0 | Retirement | Passive | 17.12% |
| 3 | Sogo Marketriders | Diversified Income – Starter | Just Invest, Retirement | Passive | 16.39% |
If you’re an extremely conservative investor or a retiree you might be interested in learning more about Wealthfront’s lowest risk portfolios.
Another advantage of the Wealthfront robo-advisor is their high yield cash account. You can have part of your money invested in a managed account and while using the no-fee cash account for ready cash.
Income Portfolios – Retirement
Maximum Equity Allocation of 45%
Category average return – 14.62%
| Ranking | Robo Advisor | Portfolio Name | Account Type | Investment Strategy | 1 year Performance |
| 1 | Wealthfront | Risk Score 3.5 | Retirement | Passive | 20.34% |
| 2 | Wealthfront | Risk Score 3.0 | Retirement | Passive | 19.85% |
| 3 | Wealthfront | Risk Score 2.5 | Retirement | Passive | 18.85% |
Wealthfront took the lead in this 45% maximum equity retirement portfolio. As would be expected, with up to 45% equities, the riskier, higher equity portfolio would generate higher returns.
With a low $500 minimum investment minimum, and competitive 0.25% AUM fee, Wealthfront has a lot going for it. Other Wealthfront features include superb PATH digital financial planner, passive and actively managed investment portfolios and a high interest cash account.
Investors who sign up for Wealthfront with this link get their first $5,000 managed for free.
Balanced Portfolios – Retirement
Maximum Equity Allocation of 60%
Category average return – 16.78%
| Ranking | Robo Advisor | Portfolio Name | Account Type | Investment Strategy | 1 year Performance |
| 1 | Wealthfront | Risk Score 6.0 | Retirement | Passive | 22.72% |
| 2 | Wealthfront | Risk Score 5.5 | Retirement | Passive | 22.50% |
| 3 | Wealthfront | Risk Score 5.0 | Retirement | Passive | 22.16% |
The balanced retirement portfolio, 60% stock, 40% bond allocation is a very popular asset allocation.
This year, with the stellar stock market returns, Wealthfront’s returns reflect the outperformance of riskier stock investments with the 6.0 risk score outperforming the 5.0 risk score by roughly a half percent.
To understand why Wealthfront has been dominating this category, here’s a look at the Wealthfront investment funds:
Wealthfront Investment Funds
| Investment Fund Category | Index Fund Ticker Symbol |
|---|---|
| US Total Stock Market | VTI and SCHB |
| Foreign Stock - Developed Market | VEA and SCHF |
| Foreign Stock - Emerging Market | VWO and IEMG |
| Dividend Appreciation Stock | VIG and SCHD |
| US Treasury Inflation Protected Bond (TIPs) | SCHP and VTIP |
| US Government Bond | BND and BIV |
| Municipal Bond | VTEB and TFI |
| US Corporate Bond | LQD |
| Foreign-Emerging Market Bond | EMB |
| Real Estate | VNQ and SCHH |
| Natural Resources (Energy) | XLE and VDE |
Wealthfront’s returns are influenced by not only the percentages investing in the broad stock, bond and alternative (real estate and energy) asset classes but also what percentages are allocated to various U.S. and international stock funds. Also the allocation among bond funds influences the ultimate return.
Wealthfront also took the Growth Portfolios – Retirement best robo investing returns prize with portfolios with risk scores spanning 7.5 to 8.5. This portfolio allows up to 75% allocated to equities.
Take a look around the Wealthfront platform. You can sign up for free, answer a few questions and find out which portfolio they recommend for you.
The final and riskiest retirement portfolio yielded another class of winners.
Value Portfolios – Retirement
Maximum Equity Allocation of 100%
Category average return – 22.74%
| Ranking | Robo Advisor | Portfolio Name | Account Type | Investment Strategy | 1 year Performance |
| 1 | Stash Invest | Clean & Green | Just Invest, Retirement | Sustainable | 43.81% |
| 2 | Aspiration | Redwood | Just Invest, Retirement | Sustainable | 37.30% |
| 3 | Stash Invest | Blue Chips | Just Invest,
Retirement | Passive | 31.43% |
We don’t recommend a 100% equity allocation for anyone except the most aggressive investors, who can handle the possibility of a 30% to 40% decline in their portfolio in a down market year.
That said, the Stash Invest and Aspiration robo-advisors won with their impact investing green portfolios. While the Stash Invest Blue Chip portfolio rounded out the third place for risk seeking investors.
Best Robo-Advisor Performance – Just Invest Portfolios – by Risk Level
The next five categories of best robo-advisor returns are categorized by the maximum percent invested in equities.
As previously mentioned, these are not head-to-head comparisons because there might be varying percentages of equities vs. fixed vs. alternative assets. The only requirement is that the equity portion is less than the designated percentage.
For further information, you can visit the listed robo-advisor and learn the exact composition of the investments recommended within each portfolio.
We’ll delve into the middle three of the five “just invest’ portfolios, as these cover the most popular asset allocations.
Income Portfolios – Just Invest
Maximum Equity Allocation of 45%
Category average return – 14.24%
| Ranking | Robo Advisor | Portfolio Name | Account Type | Investment Strategy | 1 year Performance |
| 1 | Sogo Marketriders | Moderate Income-Starter | Just Invest, Retirement | Passive | 18.24% |
| 2 | TIAA Personal Portfolio | Moderately Conservative | Just Invest, Retirement | Active | 17.95% |
| 3 | Acorns | Moderately Conservative | Just Invest, Retirement | Passive | 17.73% |
Sogo Marketriders requires a $1,000 minimum investment for core portfolios and charges a .75% management fee which includes access to financial advisors. We are uncomfortable with the Sogo Marketriders unsecured website.
The TIAA Personal Portfolio requires a $5,000 minimum investment amount and charges a 0.30% of AUM fee. Financial consultants are available during normal business hours.
Acorns is a “spare change” investment app with sliding fees and designed for new investors. Go directly to the Acorns app and check it out now!
Balanced Portfolios – Just Invest
Maximum Equity Allocation of 60%
Category average return – 16.32%
| Ranking | Robo Advisor | Portfolio Name | Account Type | Investment Strategy | 1 year Performance |
| 1 | Acorns | Moderate | Just Invest, Retirement | Passive | 22.97% |
| 2 | TIAA Personal Portfolios | Moderate | Just Invest, Retirement | Active | 20.55% |
| 3 | Axos Invest (formerly Wisebanyan) | 60% Stock | Just Invest, Retirement | Passive | 20.42% |
Similar to the Income portfolios above, TIAA and Acorns had the top two robo advisor returns. While Axos Invest (formerly Wisebanyan) came in third place.
Axos Invest only requires $1 to begin investing and manages your money for free, for their basic service. Add on services such as the Tax Protection Package and Portfolio Plus charge small fees.
Bonus: Top Robo Advisor News
If you deduct management fees from Acorns and TIAA, you’ll find a close three-way race for the top of the robo investor performance race.
The next Just Invest Portfolio allocates a maximum 75% to equity funds. This is near the top equity percent threshold that we’re comfortable with for the majority of investors.
Growth Portfolios – Just Invest
Maximum Equity Allocation of 75%
Category average return – 18.71%
| Ranking | Robo Advisor | Portfolio Name | Account Type | Investment Strategy | 1 year Performance |
| 1 | TIAA Personal Portfolios | Moderately Aggressive | Just Invest, Retirement | Sustainable | 22.77% |
| 2 | TIAA Personal Portfolios | Moderately Aggressive | Just Invest, Retirement | Active | 22.71% |
| 3 | TIAA Personal Portfolios | Moderately Aggressive | Just Invest, Retirement | Passive | 22.36% |
TIAA swept the top three spots with their moderately aggressive portfolios with distinct investment strategies. Notice that the returns are all in the 22% range.
The most aggressive Just Invest Portfolio with a maximum of 100% equities found Stash Invest and Aspiration in the top three spots.
Best Robo-Advisor Performance Wrap Up
The best performing robo-advisors in 2019 measured frequency of winning categories is Wealthfront and TIAA Personal Portfolios. Both robo-advisor are relatively low fee with a variety of other features. Although Wealthfront is a digital only investment platform, their PATH financial advisor makes a strong attempt at matching the service of a financial advisor.
It only takes a few minutes to get a customized portfolio from Wealthfront, and no payment is required.
TIAA Personal Portfolios offer financial consultants and a variety of investment styles.
As we mentioned at the outset, robo-advisor performance rankings should not be the main reason to choose a robo-advisor. You should consider your own personal situation, fees, investment minimums, investment style and more before investing with a robo-advisor.
Finally, one issue we have with this data is that we don’t know the exact asset allocation of each portfolio. In order to know the underlying percentage of stocks vs. bonds vs. alternative assets you’ll need to visit the specific robo-advisor.
Visit our Robo-Advisor Comparison Wizard for help picking the best robo-advisor for you.
All data and information used with permission of Nummo financial management. Download the complete Nummo Robo-Advisor Ranking Report, including the robo-advisors with the lowest returns by category.
Disclosure: Please note that this article may contain affiliate links which means that – at zero cost to you – I might earn a commission if you sign up or buy through the affiliate link. That said, I never recommend anything I don’t believe is valuable.