Elm Funds Review for the Smart Wealthy Investor
What is Elm Partners aka Elm Wealth?
The Elm Partners robo-advisor was born when Victor Haghani couldn’t find the investment offering he wanted for his own family’s savings. He’d made a study of family wealth over the 20th century and concluded that large family investment pools had massively under-performed the returns available in major public markets, even accounting for taxes and spending. You can listen to his TedX talk “Where Are the Missing Billionaires?”
His conclusion was that these families were undone through a combination of investing ills:
- High fees
- Low diversification
- Leverage
- Complexity
- Over-betting
Haghani was determined to learn from this history, and also from his own experience as a founding partner of the hedge fund Long Term Capital Management, which failed spectacularly in 1998 also due to a combination of leverage, complexity, and over-betting.
[toc]
Going forward he wanted an investment approach which was straightforward and low-cost, and which would efficiently harvest the returns available in major public markets. It had to be appropriate for large fractions of his total wealth, otherwise he’d still end up with lots of independent investment strategies, a recipe for complexity and high fees. And it had to be psychologically comfortable to hold in large amount for the long run, otherwise he and his family wouldn’t be likely to stick with the program.
Put all that together, and you get an investment program which is:
- Rules based: to keep costs low and consistency high
- Long-only and unlevered: So it’s appropriate for large fractions of wealth
- Dynamic: So it’s comfortable to hold through booms and busts, and avoids over-betting
- Diversified: So all your eggs aren’t in one basket
In 2012 when Elm Funds began there weren’t any low-cost investment products which met all these requirements, and there still aren’t – except Elm Partners or Elm Wealth, as it is frequently referred to.
Elm Partners Features at a Glance
| Overview | Rules based, actively managed robo-advisor for wealthy investors. Investments are held in your own Fidelity account. |
| Minimum Investment Amount | $500,000 |
| Fee Structure | 0.12% of AUM |
| Investment Strategy | Dynamic Global Asset Allocation. Increases allocation to undervalued and momentum asset classes and decreases exposure to highly valued, low-momentum asset classes. No leverage / no shorting / no stock-picking |
| Investment Funds | Low fee passive index mutual and exchange traded funds from diverse asset classes. |
| Account Custody | Separately Managed Account (SMA) at Fidelity |
| Available Accounts | Individual and Joint investment accounts. Retirement accounts: IRA, rollover IRA, 401(k). Trust and Business accounts ie LLC, LP |
| Contact & Investment Advice | Phone contact available M-F, Email – 24/7. No investment advice available. |
What are Elm Partners Benefits?
A low-cost portfolio you can feel comfortable holding in large size for long periods of time
A portfolio that’s both dynamic and efficient – Elm’s dynamic asset allocation weights are sensible and rational, without giving up efficiency
A portfolio that scales risky assets proportional to their expected excess return which leads to a better expected risk/reward profile vs. a static portfolio.
How Elm Partners Works – How Does Elm Wealth Invest?
Elm Partners Baseline Asset Allocation
Elm’s asset allocation is dynamic and changes through time, but the ‘Baseline’ is what sets the long-term level of risk and average asset allocation.
The Baseline portfolio is the starting point for Elm’s dynamic asset allocation methodology and is the average portfolio likely to be held over time.
The Elm funds baseline investment asset allocation starts with dividing the portfolio into Global Equities, U.S. Fixed Income, and Cash/Money Markets:
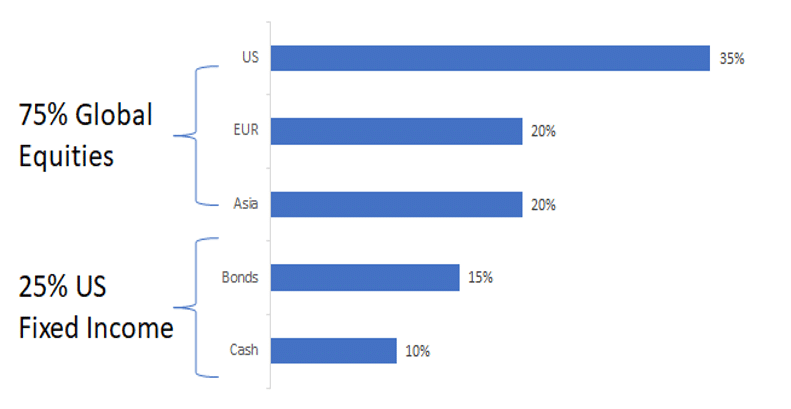
The split between Equities and Fixed-Income/Cash is appropriate for investors with a range of risk-aversion levels consistent with Elm’s core investor group of senior finance professionals. The Elm Partners dynamic asset allocation will be described in depth below.
U.S. vs. International Equities
Drilling down within the Equity portion of the Baseline, Elm created the U.S. versus international equity distribution with these considerations.
Elm selected an equity allocation which is highly diversified and not too far from global market cap weights, while also avoiding the tendency of ‘naive’ indexing to sometimes become overly exposed to one highly appreciated asset. To accomplish this, Elm Partners updates the equity Baseline annually, using a diverse group of inputs while also not allowing the final result to deviate too dramatically from market weights.
Below is the Elm global baseline allocation in comparison with various unmanaged indexes, regional earnings, unadjusted market cap, GDP and the world population.
Elm Geographical Allocation versus Various Metrics
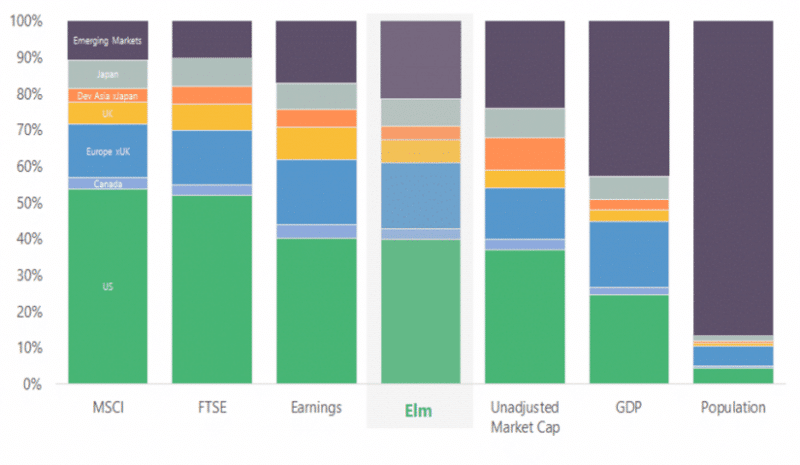
Chart Index:
- Plum – Emerging Markets
- Grey – Japan
- Orange – Developed Asian Markets and Japan
- Gold – United Kingdome
- Blue – Europe ex-UK
- Lavender – Canada
- Green – U.S.
Notice that Elm’s global allocation closely mirrors the unadjusted world market cap.
Sign up for Free Investment Management software from Peronal Capital (no strings attached).
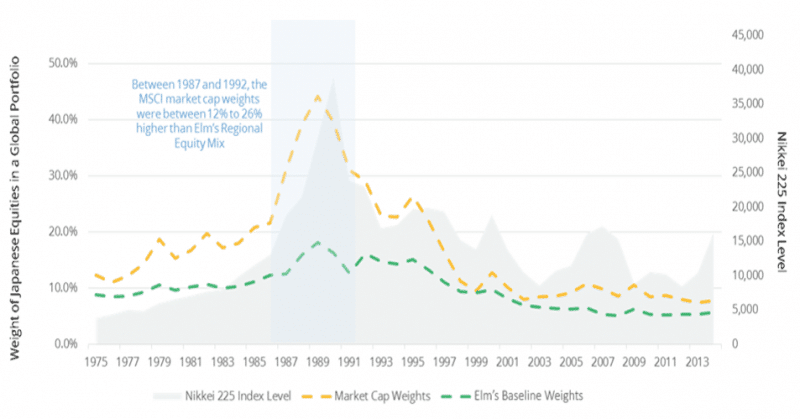
The chart below demonstrates an example of the baseline methodology (highlighting Japan) in practice vs. a market weight portfolio of the same asset classes:
During the 1980s when Japan was experiencing a roaring market with highly elevated valuations, a ‘pure’ indexing approach would have assigned Japan a weight totally out of context with its historical weight. In contrast, Elm Partners baseline asset allocation approach produces a more moderate asset class weight.
(For illustration purposes only)
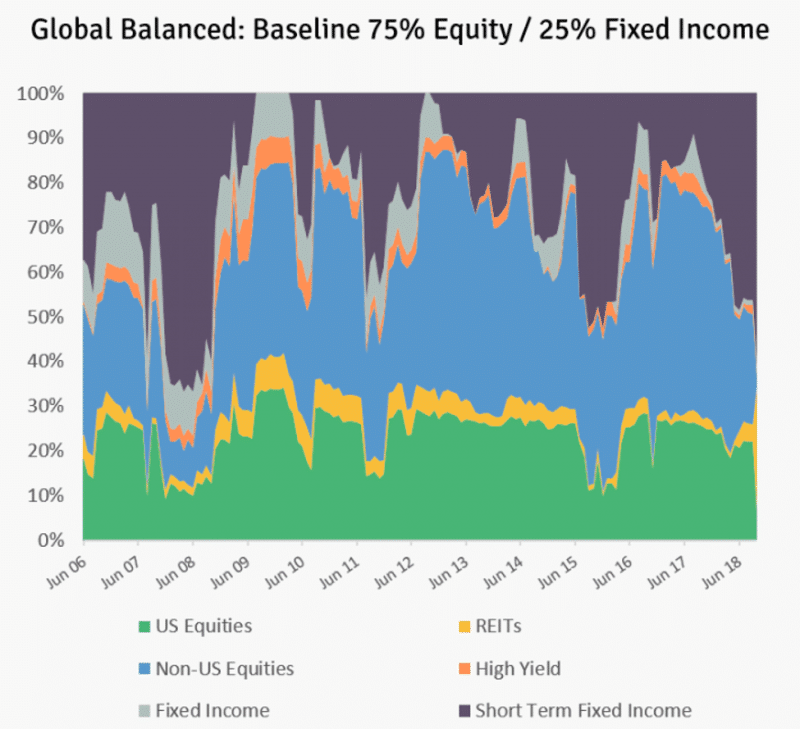
Elm Partners Dynamic Asset Allocation
Elm created a dynamic asset allocation, governed by rules and implemented by a computer algorithm.
“The intuitive logic behind Elm’s dynamic asset allocation is that we want to have the most exposure relative to the Baseline when it has the highest expected return, and the least exposure when expected returns are lowest.” ~James White, Elm Partners CEO
Haghani and White believe that medium-term expected returns are driven by a combination of fundamental valuations and price momentum. The Elm underlying asset allocation is governed by these factors.
Valuation is a measure of a sectors price relative to historical price and calculated based on several fundamental measures such as earnings yield and dividend yield.
Momentum compares the current asset value to its prior 12-month average and incorporates inflation, dividends and risk factors.
The following chart shows how each asset class is evaluated and then allocated based on it’s respective valuation and momentum.
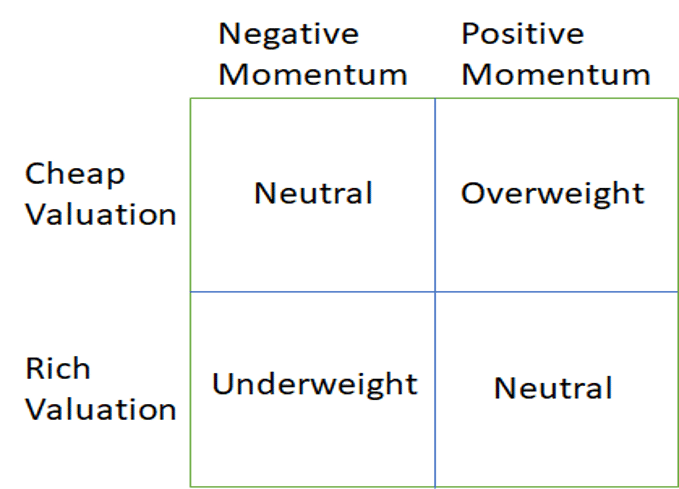
The analysis of the findings from the valuation and momentum factors drives the asset allocation.
For example, we are currently in a richly valued U.S. equity market with positive momentum. Thus, our dynamic asset allocation is neutral for that asset class. This suggests that the current asset allocation is close to the baseline allocation for U.S. assets.
Elm Partner’s Valuation and Momentum Metrics With Asset Allocation Percentages
This a view of the Elm Partners dynamic asset allocation.
An asset allocation driven by Elm Partner’s valuation and momentum metrics would have evolved through time like this:
Important disclosures: This chart uses simulated data which do not reflect real trading results and were calculated using a model developed with the benefit of hindsight. The model used here is not identical to the model used by Elm Partners for managing client assets today. For many of the period shown, Elm Partners was not managing client assets. Clients may experience significant losses. These returns should not be considered indicative of Elm Partners’ skill as an adviser. Past returns are not indicative of future returns.
The portfolio can be quite dynamic – just over this sample period the fraction invested in equities has been as high as 85% and as low as 25%.
The 85% equity level in 2009 was the result of very cheap global equity valuations, positive equity momentum, and very expensive U.S. Fixed Income valuations. Global equity expected returns were very high, thus international equity exposure was proportionally high.
The low 25% equity allocation in 2008 was the result of very rich global equity valuations and negative equity momentum. Global equity expected returns were low, thus equity exposure proportionally low. This was also concurrent with the U.S. recession, and the stock market decline following the mortgage meltdown and sub-prime mortgage crash.
During 2008-2009, the Elm model worked to keep equity exposure low before the mortgage meltdown crash thereby tempering the market decline, while loading up on equities near the market bottom.
Interested in a deeper analysis of Elm Partners investment style? You can learn more about how Elm Partners invests here.
Elm Partners Security Selection
Each of the asset buckets in the baseline is expressed through broad, liquid, low-cost ETFs and index mutual funds. The cash bucket uses ETFs holding US Treasury Bills and Notes with a weighted-average duration of one year. Elm only uses instruments which meets the firm’s requirements for size, liquidity, quality and cost. The company routinely updates the characteristics of the available security universe to ensure that they are using the most optimal instruments available.
Execution
Each week Elm rebalances 25% of every portfolio, so that the entire portfolio is being rebalanced once every month, but without having too much exposure to one particular rebalancing date.
Elm employs a proprietary execution optimizer, which for every account mutually optimizes for:
- Minimum transaction costs
- Minimum net tax costs (for taxable accounts)
- Minimum deviations from portfolio target weights
- Tax-loss harvesting opportunities when available (for taxable accounts)
The execution optimizer operates at the level of individual tax lots in each account and produces trades which are distinct for each account. Because accounts may have different size, holdings, tax lot distribution and cost bases, efficient execution is highly individualized. The net result of this careful, optimized execution is that Elm’s dynamic strategy can be implemented with expected tax and transaction costs comparable to those of a traditional static strategy.
Once trades have been selected for each account, Elm’s execution at Fidelity is also automated, allowing Elm to keep costs low but efficiency and consistency high.
Elm Wealth Returns
The Elm partners investment returns will depend upon a variety of factors including:
- When the account was opened.
- The asset allocation of the portfolio during the investment period.
- The performance of the underlying asset classes during the investment period.
Ultimately, the returns will be commensurate with those of the investment funds owned and their percentages within the portfolio during the specific time period, less the 0.12% management fee.
You can expect Elm Partners returns and performance to be less volatile than a static 75% equity and 25% fixed portfolio.
Rationale for Elm Partners Investment Strategy
A Case Study of Valuation and Momentum Investing
If there were no historical market price information at all, but you had some knowledge of basic economics and human behavior, Elm believes that their approach still stands up well. Elm sees this ‘grounding’ in ideas not totally dependent on a specific realized return record to be a highly desirable feature. Elm’s strategy is likely to perform as expected in future market environments which may not look like anything like the past.
“We would not advise choosing any investment approach, including Elm’s, primarily based on historical performance,” ~Victor Haghani, founder Elm
However, once you’ve established that you agree with a particular investment philosophy and the thinking behind it, checking that it would have performed as expected in the history we’ve had is perfectly reasonable.
“A Case Study for Using Value and Momentum at the Asset Class Level” by Victor Haghani and Richard Dewey, in the Journal of Portfolio Management in Spring 2016, showed that a simple combination of valuation and momentum metrics would have improved a static portfolio in every full decade since the beginning of the sample period in 1923.
The static portfolio approximated the following asset allocation:
- 21% – U.S. Equities
- 24% – International Equities
- 10% – Reits
- 10% – Commodities
- 20% – US Fixed Assets
- 15% – Cash
Static Passive Portfolio Returns vs. Value and Momentum Fluid Asset Allocation
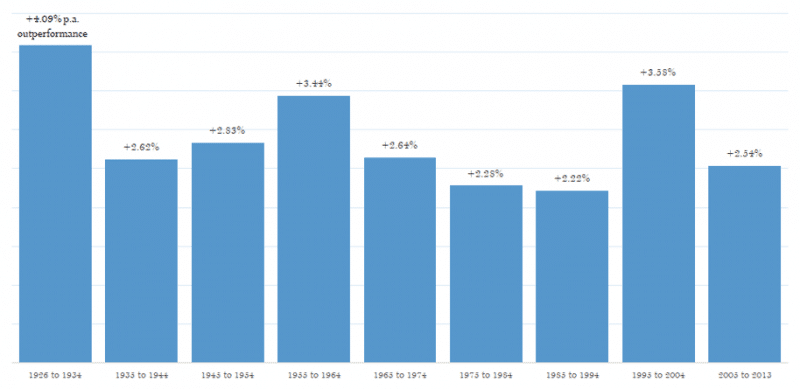
Chart and Static Asset Allocation Source: “A Case Study for Using Value and Momentum at the Asset Class Level,” Journal of Portfolio Management (Spring 2016)
Disclosures:
The static asset classes used in this study included U.S. equities, European equities for the entire period and developed Asia and emerging markets for some of the later periods. Indices and other proxy data were used instead of actual financial instruments.
This chart uses simulated returns which do not reflect real trading results and were calculated using a model developed with the benefit of hindsight. The model used here is not identical to the model used by Elm Partners for managing client assets today. For the majority of the period shown, Elm Partners was not managing client assets. Clients may experience significant losses. These returns should not be considered indicative of Elm Partners’ skill as an adviser. Past returns are not indicative of future returns.
The Elm team doesn’t conclude from this history that valuation and momentum strategy will add value in every decade going forward or in future market environments – we all know that past performance is not indicative of future results. Although, the value and momentum strategy in the past performed according to Elm’s expectations.
Looking to the future, investors must rely on their own judgement and analysis about a strategy’s investment philosophy, not any past history of simulated or actual returns.
Elm Partners Account Structure
An Elm-managed account is a normal Fidelity or Schwab brokerage account, accessible through those investment firms like any of your investment accounts. As the 3rd-party manager, Elm can place trades in the account on your behalf, but assets remain in your name at all times, and only you can transfer cash and assets in our out of the account.[1] You will receive typical trade confirmations and brokerage statements from Fidelity, and a quarterly letter from Elm.
[1] Except for fees
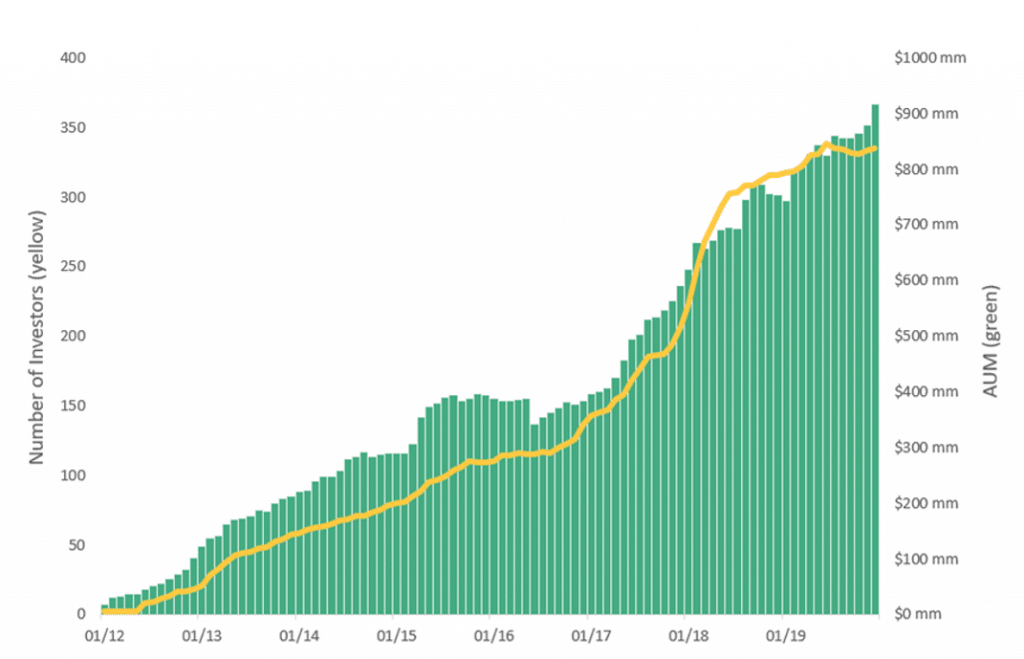
Elm Partners Assets Under Management
Many wealthy families have seen the merit in the Elm Funds approach.
Currently, Elm Partners manages approximately $1 billion dollars from more than 300 investors.
Is Elm Partners For You?
Elm may be a good fit for:
Sophisticated investors and financial professionals who are already investing in a similar style themselves or would like to be.
A high-net-worth investor with normal levels of risk-aversion looking for a single robust, low-cost investing solution for a large fraction of total liquid wealth.
A high-net-worth investor attracted to the benefits of low-cost passive indexing, but who knows a long-run static portfolio won’t be comfortable or achievable.
Elm Partners Pros and Cons
Elm Partners Advantages
Intuitively, the theory behind Elm Partners investment style makes sense. The back-tested data seems to support the approach. For investors that are seeking a way to take advantage of market growth, when valuations are low or fair, and minimize losses during market downturns, Elm appears to be a viable option.
Elm Partner’s low 0.12% investment management is unheard of in the high net worth investing community and is a tribute to their sensible ideology. The platform’s asset growth underscores the reality that regardless of net worth, investors are mindful of fees and appreciate the opportunity to invest in a platform with reasonably priced services.
Elm Partners Disadvantages
The primary Elm disadvantage is that it is for wealthy investors. Unless you are an accredited investor with a liquid net worth of $1 million, or $200,000 annual income (or $300,00 income if married), and $500,000 available to invest, then Elm isn’t for you.
For investors with less than $500,000 to invest, check out the Betterment robo-advisor with financial advisors.
Elm Wealth Review Wrap Up
Elm is long-only, so in general when global equities are doing well Elm will be doing well, and when equities are down Elm will be also.
Elm is highly diversified, so it will always be performing better than the worst-performing market and will always lag the best-performing market.
Elm is rules based, and the investment managers do not lightly override or modify the rules. So, some individual asset allocation decisions will likely align with the investors’ personal intuition, and inevitably some won’t.
Elm’s premise is not that every rules-based decision will feel right to you, but rather that in aggregate and over time the rule set produces a portfolio which is consistent and comfortable, without sacrificing risk-adjusted return.
We believe this is a viable, low-fee, soundly researched investment option for high net worth individuals. For those preferring the opportunity to temper risk while capturing a great percent of the global market upside. Both founder, Victor Haghani and CEO, James White, have most of their liquid assets invested in the Elm Partners platform, further reinforcing their confidence in the model.
Elm does not provide investment guidance, tax or estate planning information. Thus, when investing with Elm clients need to hire their own financial, tax and estate planning advisors.
How To Invest With Elm Wealth?
For more information please visit the website, take a look at the research on the Elm Wealth Blog here, where you’ll find fascinating investing research and insights as well as an Elm Partners interview with NYU Professor Aswath Damodaran. Elm Partners is happy to answer questions by phone or email as well.
Finally, you can quickly sign up for Elm online.
Related
- Personal Capital Review – High New Worth Investment Advisors
- Ellevest – Robo advisor for women
- Betterment Review – Robo Advisor with Financial Advisors
- Interactive Advisors Review – Managed Portfolios for All
- T Rowe Price Active Portfolios Plus Review
- Domain Money Review – Crypto and Stock Investing
- Best Robo Advisors For Wealthy Investors
Disclosure: Please note that this article may contain affiliate links which means that – at zero cost to you – I might earn a commission if you sign up or buy through the affiliate link. That said, I never recommend anything I don’t believe is valuable.